Differential Expression Analysis
Identify significantly differentially expressed genes with interactive thresholds
Volcano plots are a standard method for visualizing differential expression (DE) results. They display thousands of genes simultaneously, making it easy to identify:
- Upregulated genes - Higher expression in treatment vs. control
- Downregulated genes - Lower expression in treatment vs. control
- Statistically significant changes - Based on p-value or FDR thresholds
- Biologically meaningful changes - Based on fold-change magnitude
The Volcano module provides real-time threshold adjustment, allowing you to explore different significance cutoffs without re-analyzing your data.
Input Requirements
Required Files
Differential Expression File
- Filename must contain keywords:
diff,differential,de,expression,diffexp - Examples:
DESeq2_results.csv,differential_expression_WT_vs_KO.tsv
File Format
Your DE file must contain these columns:
-
Gene/Transcript Identifier
- Column can have any name (e.g.,
gene_id,symbol,ensembl_id) - Each row represents one gene/transcript
- Column can have any name (e.g.,
-
Log Fold Change
- Column name should include:
logfc,log2fc,logfoldchange - Examples:
log2FoldChange,logFC,Log_Fold_Change - Positive values = upregulated, Negative values = downregulated
- Column name should include:
-
P-value or Adjusted P-value
- Platform searches for (in priority order):
- Adjusted:
padj,fdr,qvalue,adj_p_val - Raw:
pval,pvalue,p_value
- Adjusted:
- Uses adjusted p-value if available, otherwise raw p-value
- Platform searches for (in priority order):
Gene vs Transcript Level
- If filename contains
transcript, treated as transcript-level DE (In case of server side sorting) - Otherwise, treated as gene-level DE
- Multiple DE files can be uploaded for different comparisons
Understanding the Volcano Plot
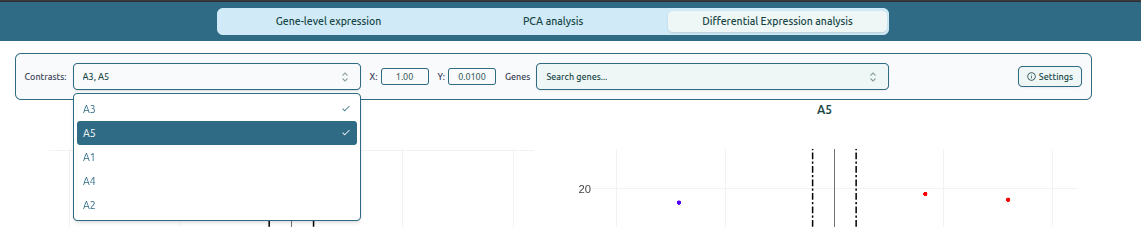
Step 1: Select Contrast and Search Genes
The top panel allows users to choose a differential-expression comparison (contrast) and optionally highlight specific genes of interest.
Contrast Selection
- Choose a comparison from the Contrast dropdown (e.g., A3).
- The volcano plot updates automatically.
Search Genes
- Use the Search Genes box to highlight specific gene IDs.
- Highlighted genes appear in orange on the plot.
Features
- Multiple genes can be selected at once.
- Hovering over highlighted points shows their identifiers.
Contrast and search bar interface
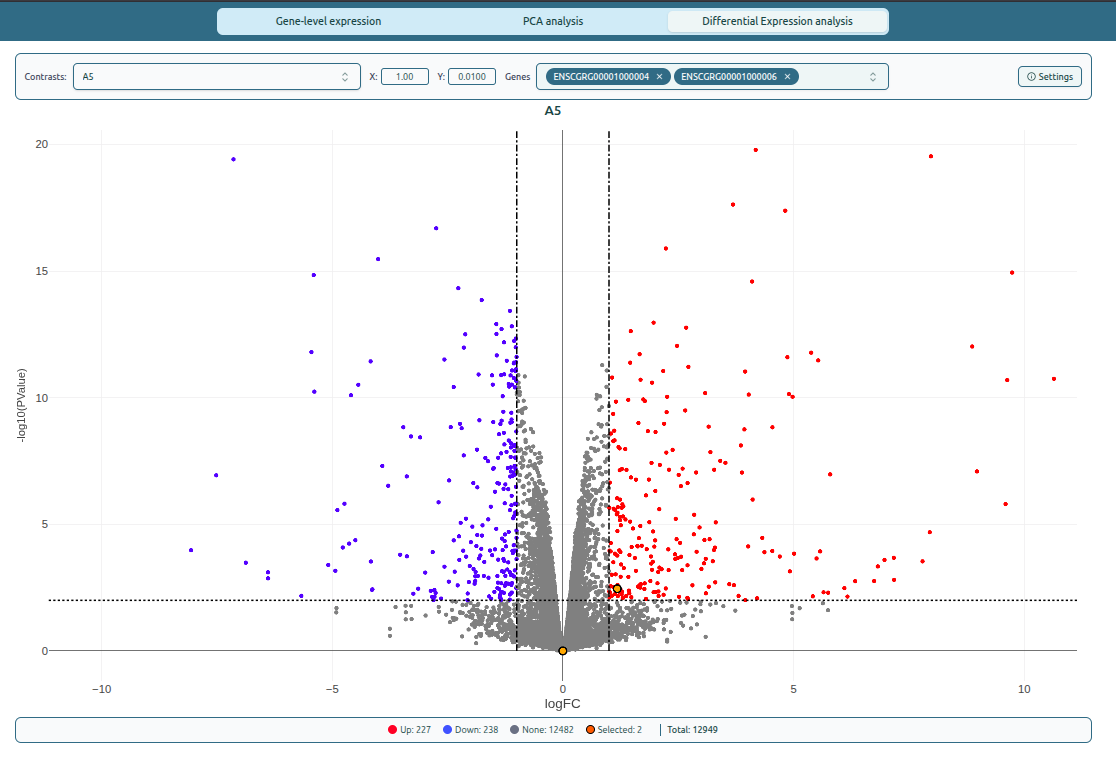
Step 2: Understand the Volcano Plot
The volcano plot helps identify significantly upregulated and downregulated genes.
Plot Layout
- X-axis (log2FC)
- Negative values → downregulated
- Positive values → upregulated
- Zero → no change
- Y-axis (-log10(p-value))
Higher values indicate greater statistical significance.
Color Coding
- 🔴 Upregulated — log2FC > threshold AND p-value < threshold
- 🔵 Downregulated — log2FC < –threshold AND p-value < threshold
- ⚫ Not significant — does not meet significance criteria
- 🟡 Highlighted genes — genes selected via Search
Visual Indicators
- Vertical dashed lines show fold change thresholds.
- Horizontal dashed line marks the significance threshold.
Volcano plot layout with thresholds
Step 3: Adjust Thresholds in Real Time
The volcano module allows real-time filtering using two threshold controls.
1. Fold Change Threshold (X)
- Controls the minimum |log2FC| required to classify a gene as up/downregulated.
- Increasing this value highlights more strongly regulated genes.
2. Significance Threshold (Y)
- Controls the minimum statistical significance required.
- Lowering the p-value threshold increases strictness.
Live Gene Counts
A summary bar shows:
- Upregulated
- Downregulated
- Not significant
- Highlighted genes
- Total genes
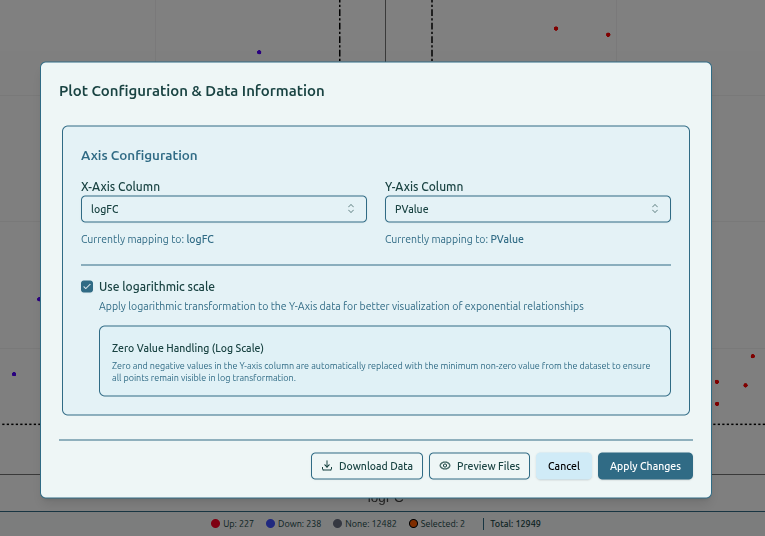
Step 4: Configure Plot Settings
The Settings panel allows configuration of axes and scale options.
Axis Configuration
- X-Axis Column — typically logFC
- Y-Axis Column — typically p-value or adjusted p-value
Logarithmic Scale
- Option to apply log transformation on the Y-axis.
- Zero or negative values are adjusted automatically to remain visible.
Additional Options
Download Data— download DE filesPreview Files— view differential expression tablesApply Changes— update plot with new settings
Settings panel for volcano plot