PCA Analysis
A module for exploring sample similarity and clustering patterns using Principal Component Analysis (PCA).
This tool reduces high-dimensional gene or transcript expression data into a small number of principal components, making it easier to visualize how samples relate to each other. By plotting PC1, PC2, and additional components derived from the uploaded expression matrices, PCA helps identify batch effects, outliers, and natural group separation across experimental conditions—without requiring any preprocessing or coding from the user.
Note: Sample colors in the PCA plot are automatically assigned based on group labels provided in the metadata file.
Step 1: View PCA Scatter Plot
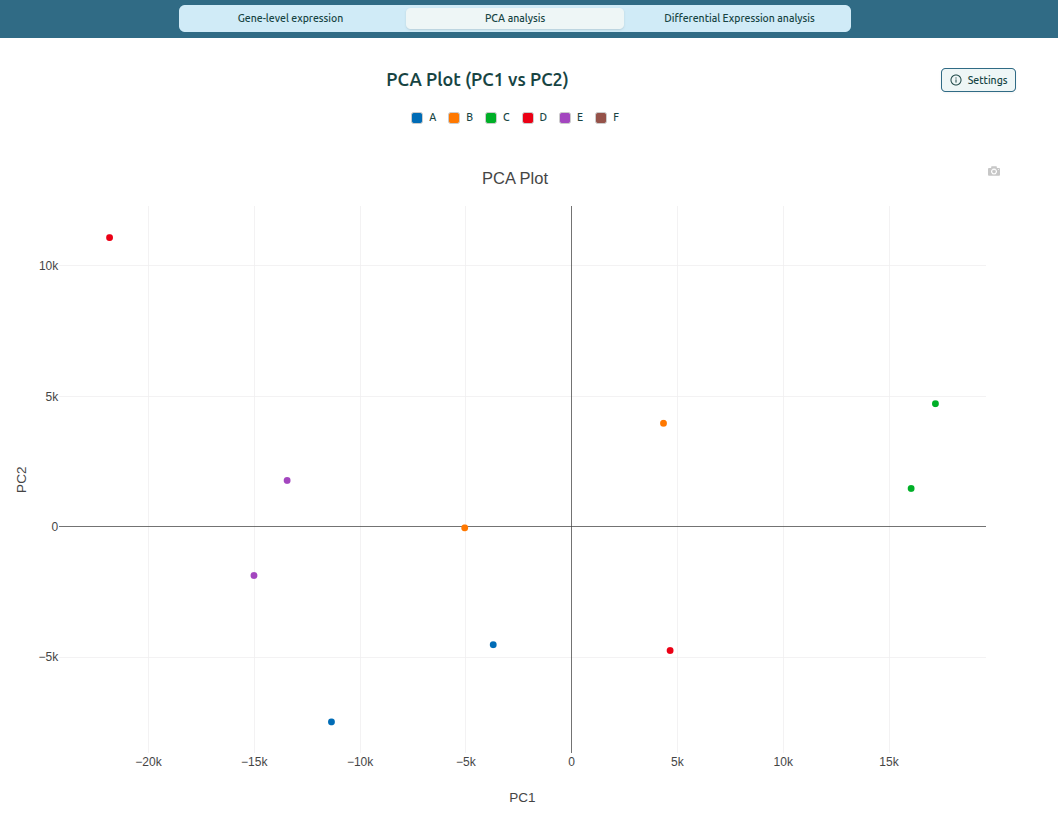
The PCA view displays samples as points on a two-dimensional scatter plot.
The default view shows PC1 vs PC2, which explains the largest variation in the dataset.
What the plot shows
- Each point represents a sample.
- Colors represent experimental groups, based on the selected Group Column.
- Axes represent the selected principal components (PC1, PC2 by default).
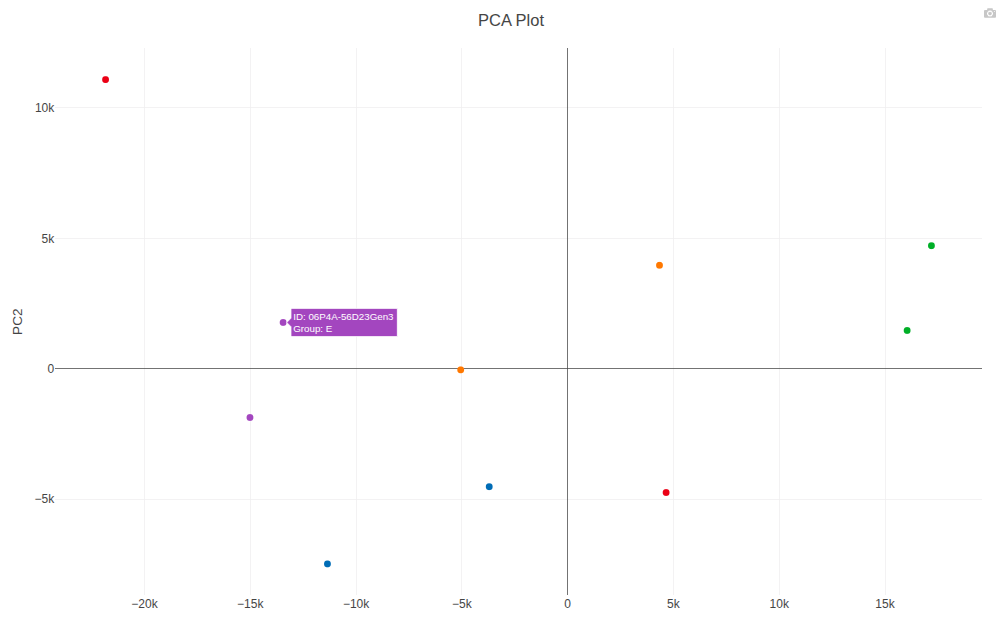
Interactive behavior
- Hovering over a point shows a tooltip with:
- Sample ID
- Group assignment
- The layout adjusts automatically when switching axes.
Example PCA scatter plot
Hover tooltip example
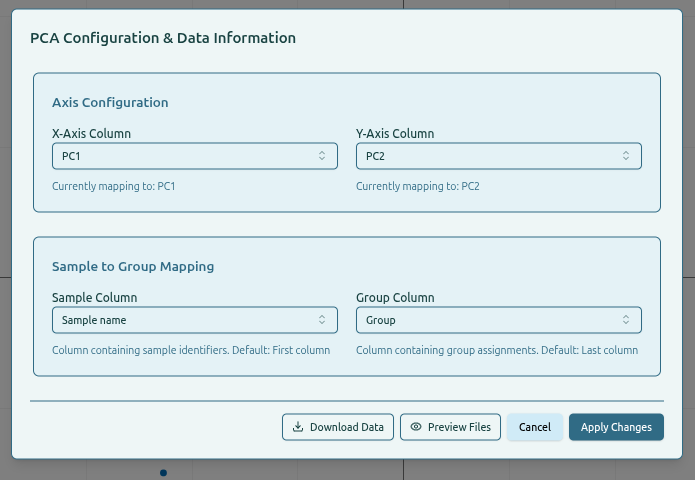
Step 2: Configure PCA Axes and Group Mapping
The Settings panel allows users to configure how PCA values and groups are displayed.
Axis Configuration
- X-Axis Column
Select which principal component appears on the horizontal axis. - Y-Axis Column
Select which principal component appears on the vertical axis.
Sample to Group Mapping
- Sample Column
Column containing sample identifiers. - Group Column
Column containing group assignments (A–F or custom labels).
How to use
- Click
Settings. - Select the desired X-axis and Y-axis components.
- Adjust Sample and Group columns if needed.
- Click
Apply Changesto update the plot.
Settings panel for PCA configuration
Step 3: Download PCA Plot
The PCA plot includes a download icon that allows users to save the figure as a PNG image.
How to download
- Click the camera icon to export the current PCA view.
Output
- High-resolution PNG file suitable for reports or presentations.